Keep learning
Revenue per customer
How do you keep happy customers that keep buying from you?
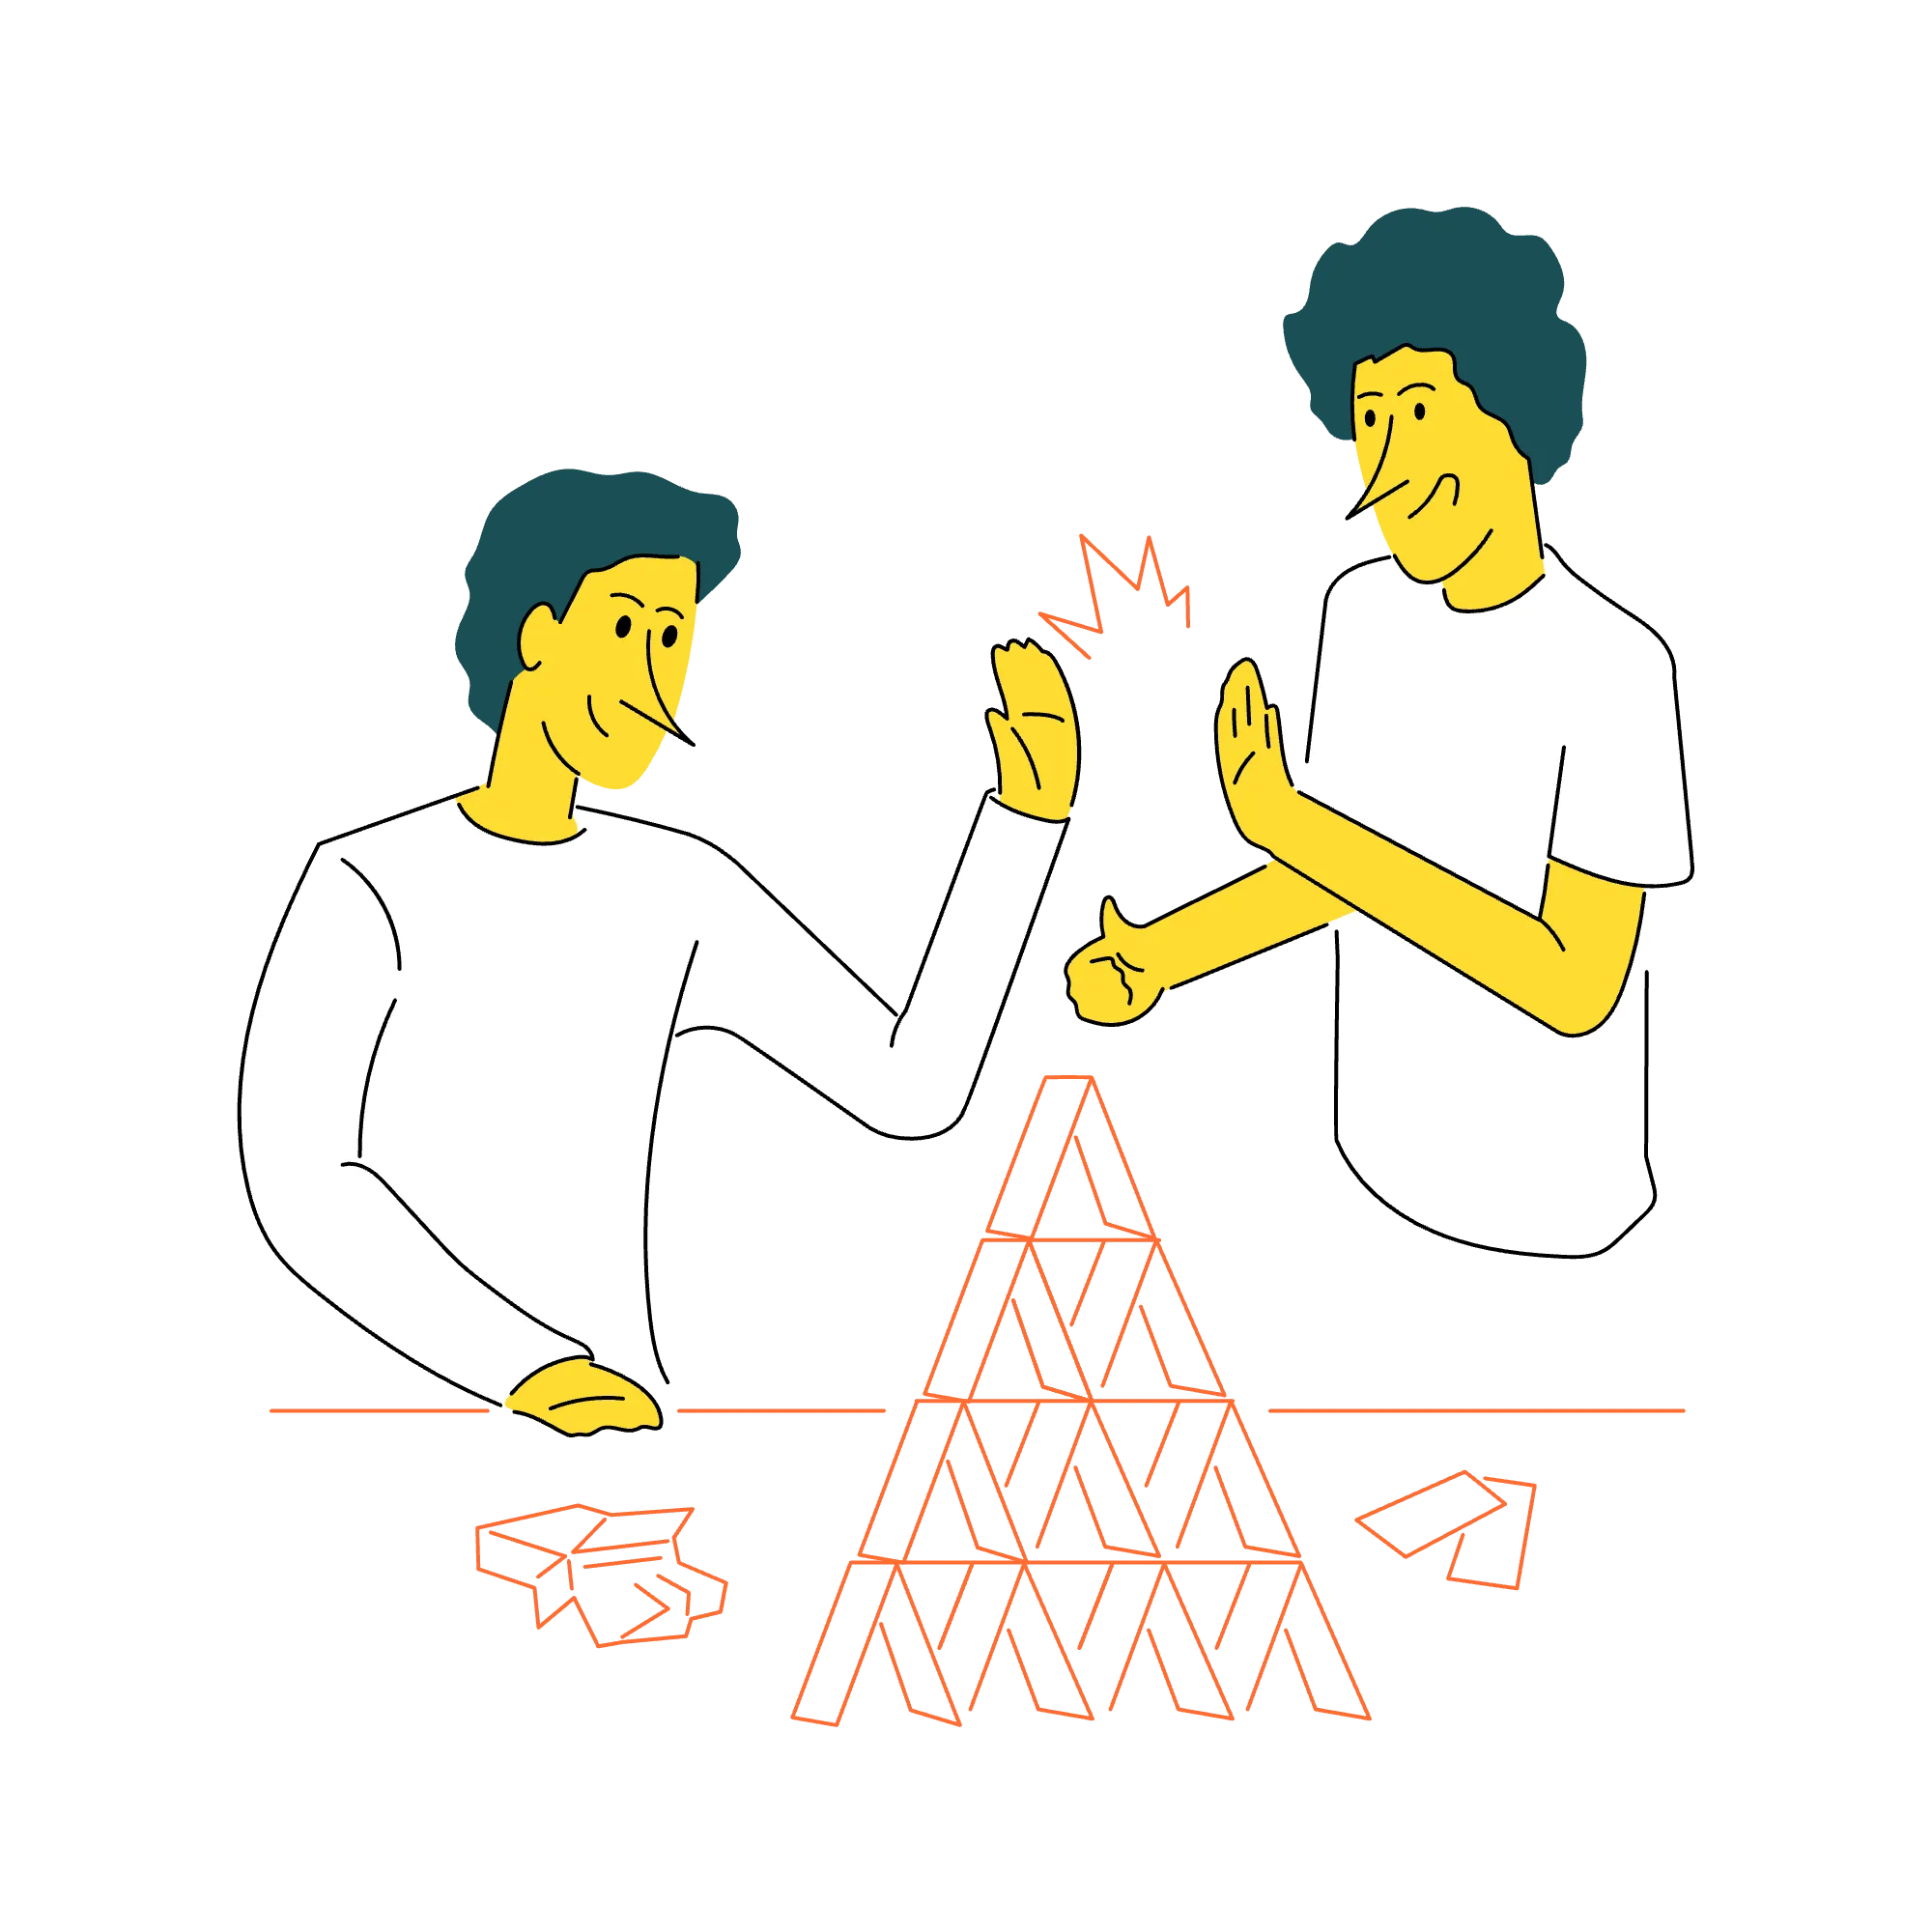
Survey customers about satisfaction with specific interactions or products to catch problems early and identify what drives positive experiences worth replicating.
.webp)
Customer Satisfaction (CSAT) is a metric that measures how satisfied a customer is with your product, service, or a specific interaction. It's typically measured on a numeric scale - usually 1-5 or 1-10 - in response to the question 'How satisfied are you with [product/service/interaction]?' The scores are then aggregated to calculate an overall CSAT percentage.
CSAT is one of several customer sentiment metrics. Unlike Net Promoter Score (NPS), which asks about willingness to recommend, CSAT focuses purely on satisfaction with a product or experience. A customer might be very satisfied with your product but not likely to recommend it, creating tension between CSAT and NPS that's worth understanding.
CSAT scores above 80% are generally considered strong. Scores of 60-80% suggest room for improvement. Scores below 60% indicate serious dissatisfaction. However, benchmarks vary by industry: B2B support satisfaction is often lower than B2C because enterprise customers have higher expectations.
For B2B growth teams, CSAT is a leading indicator of churn and expansion opportunities. Customers with high CSAT scores are less likely to cancel, more likely to renew, and more likely to buy add-on features or upsell offerings. Conversely, customers with low CSAT are at risk of churning, whether to competitors or simply by discontinuing use.
CSAT also reveals specific problems. If CSAT drops after a product update, the update may have introduced a bug or created usability issues. If CSAT varies by customer segment, one segment may be underserved. This granular insight helps you prioritise improvements.
From a sales perspective, high CSAT directly enables growth. Satisfied customers are more likely to renew, less likely to need heavy discounting at renewal, and more willing to expand relationships. If your goal is to grow revenue from existing customers, improving CSAT is often more efficient than acquiring net new customers.
Measure CSAT regularly and consistently. Most organisations survey CSAT quarterly or biannually. Decide when to measure: after a support interaction? After a major product update? At contract renewal? The timing affects what CSAT actually measures and should align with your business objectives.
Act on CSAT feedback. If you survey but don't respond to the insights, customer satisfaction often declines further - customers feel heard but unheard. When you discover low satisfaction, investigate why. When you uncover common complaints, address them. When CSAT improves, communicate that improvement back to customers.
Segment your CSAT analysis. Don't just track overall CSAT; compare satisfaction by product tier, customer segment, tenure, and usage patterns. A new customer's satisfaction might be lower during onboarding but recover over time. Understanding these patterns helps you interpret the data and identify which groups need support.
A SaaS company surveyed support CSAT after each support ticket resolution. Initial CSAT was 72%. They discovered that response time was the primary driver: tickets answered within 2 hours had 85% CSAT; tickets answered after 24 hours had 58% CSAT. They hired additional support staff to reduce response time, and CSAT improved to 81% within three months. Higher satisfaction also correlated with lower churn.
An enterprise software company released a new reporting feature and surveyed CSAT with that feature specifically. CSAT was 64%, significantly lower than their 82% product CSAT overall. They collected open feedback and discovered the feature was missing an export-to-spreadsheet capability that customers expected. They added it, resurveyed, and CSAT on that feature improved to 78% within a quarter.
A consulting platform analysed CSAT by customer company size. Enterprise customers had 79% CSAT; mid-market customers had 71% CSAT; small business customers had 68% CSAT. Investigation revealed that mid-market and small business customers were experiencing longer onboarding times and receiving less dedicated support. By implementing better self-service resources and improving onboarding for smaller customers, they closed the CSAT gap.
How do you keep happy customers that keep buying from you?

Build an onboarding and retention system that keeps customers engaged, identifies risks early, and turns satisfaction into longer relationships.
Create upsell and cross-sell workflows that grow existing accounts by matching additional solutions to evolving customer needs.

Develop a pricing structure with clear value tiers, anchoring, and packaging that reflects the value you deliver and gives buyers confidence in their investment.

Set up ticket pipelines, customer success workspace, and health scores so your team catches problems before customers churn.
Create systematic processes to gather customer input, surface issues early, and act on feedback before problems become churn events.
Identify churn patterns, build early warning systems, and create win-back campaigns for customers considering leaving to salvage relationships.
The average number of invoices issued per customer contract, reflecting contract length and billing frequency.
Combine usage, engagement, and satisfaction signals into one metric that predicts churn risk so customer success teams prioritise accounts needing intervention.
The average price charged per unit, seat, or item sold.
Calculate what percentage of customers renew subscriptions to measure product-market fit and customer success effectiveness at delivering ongoing value.
Follow structured selling frameworks that provide consistent processes for qualifying, demonstrating value, and advancing opportunities through each pipeline stage.
Proactively help customers achieve desired outcomes to drive retention and expansion by ensuring they extract maximum value from your solution.
Create single-page summaries of solutions or case studies that busy decision-makers can quickly scan to understand value without reading long documents.
The average number of units, seats, or items included on each invoice.
Track how customers interact with your product to identify power users, detect at-risk accounts, and guide feature development toward actually valuable capabilities.
Survey customers about satisfaction with specific interactions or products to catch problems early and identify what drives positive experiences worth replicating.
Provide formal pricing for requested solutions to move qualified prospects toward purchase decisions with clear costs and terms they can review and approve.
Collect specific customer quotes about results achieved to provide social proof that overcomes scepticism more effectively than marketing claims buyers discount.
Design presentation slides that guide discovery and demo conversations whilst reinforcing key messages visually so prospects retain information after meetings end.
Measure customer loyalty by asking how likely they'd recommend you to gauge satisfaction and identify promoters who drive referrals versus detractors risking churn.
Determine how to charge for products and communicate value to maximise willingness to pay whilst remaining competitive and supporting desired positioning.
Calculate the total revenue a customer relationship generates over its entire duration to guide acquisition spending and retention priorities.
Arm sales reps with competitive intelligence on one-page sheets covering competitor strengths, weaknesses, and effective counter-positioning for common objections.