Keep learning
Revenue per customer
How do you keep happy customers that keep buying from you?

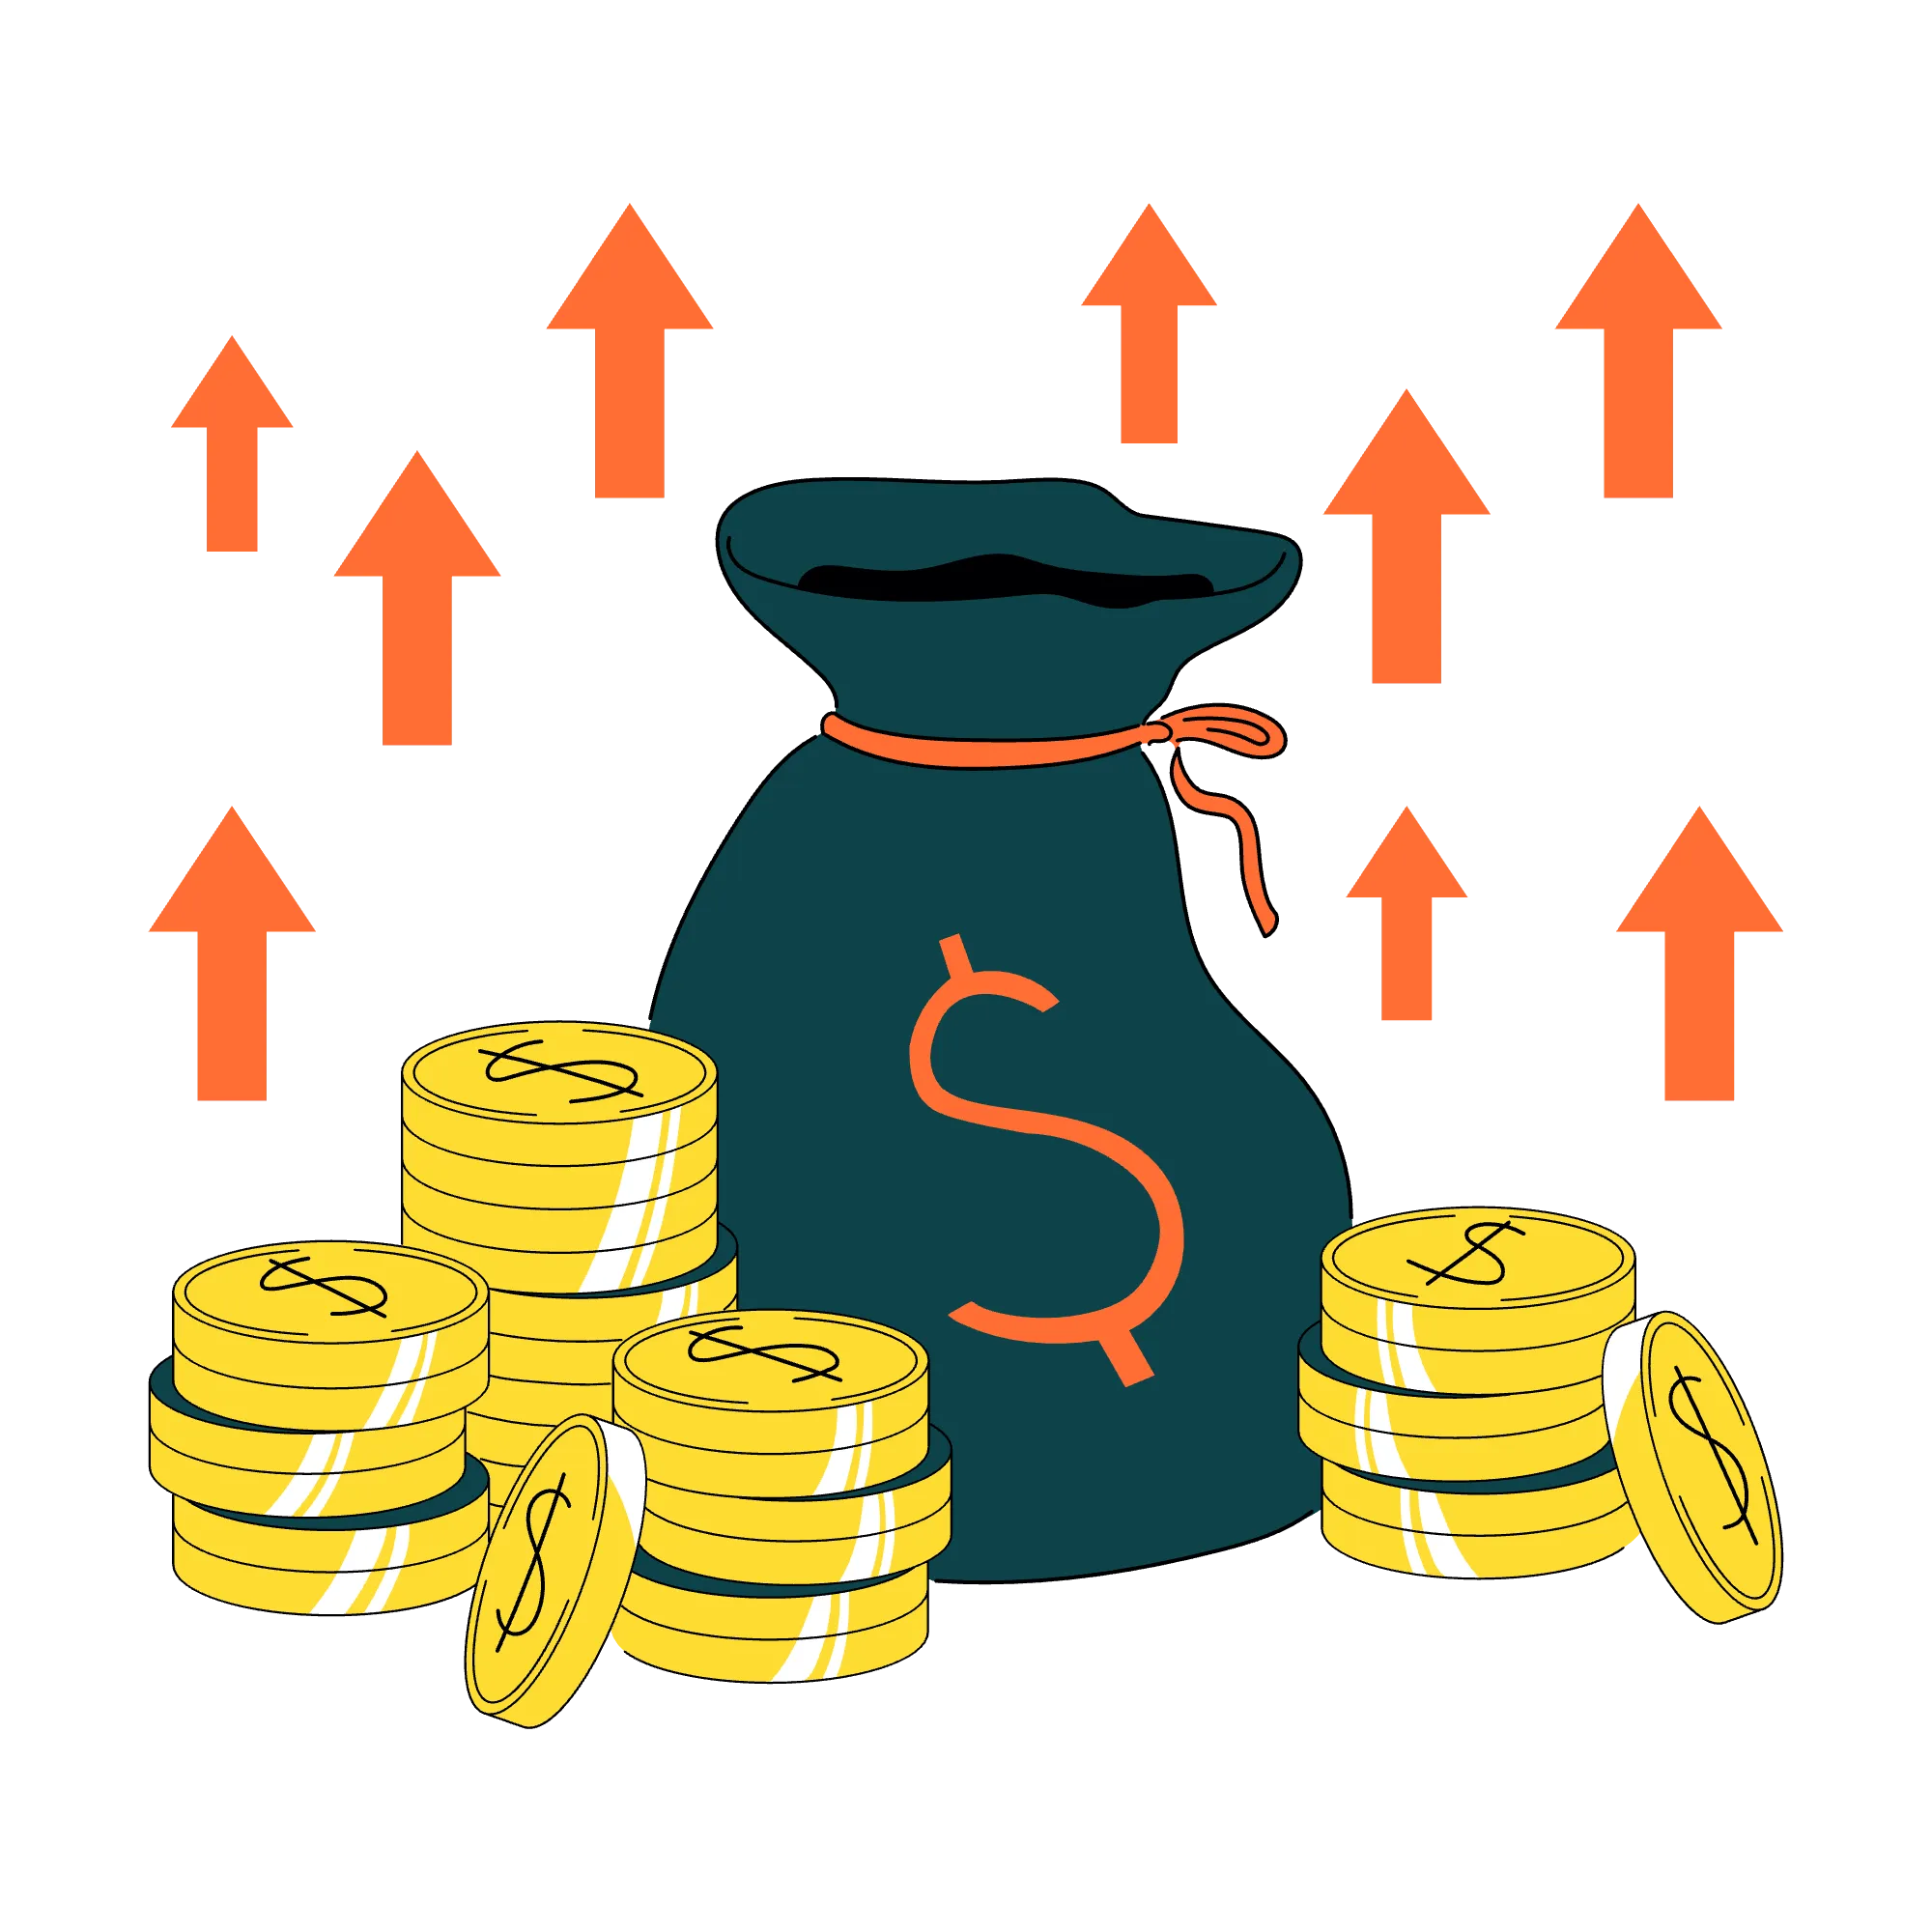
The average number of invoices issued per customer contract, reflecting contract length and billing frequency.
.webp)
Average invoices per contract measures how many billing cycles each customer relationship generates. It is calculated by dividing total invoices by total contracts over a given period.
For a monthly retainer billed monthly, a customer who stays 12 months generates 12 invoices. For a project billed in three milestones, each project generates 3 invoices.
This metric reflects contract duration and billing structure. A higher number means longer customer relationships or more frequent billing. A lower number means shorter engagements or milestone-based billing with fewer touchpoints.
For service businesses, this metric indicates customer lifetime. For subscription businesses, it correlates with retention. The longer customers stay, the more invoices per contract.
Increasing this metric means either extending customer relationships or changing billing structure to capture value more frequently.
Average invoices per contract tells you how long customer relationships last in billing terms. It is a proxy for retention and customer lifetime value. More invoices per contract means more revenue from each customer you acquire.
This metric matters most for recurring revenue businesses. If you sell one-off projects, you might have exactly one invoice per contract. If you sell retainers, you want this number as high as possible.
This metric directly impacts customer lifetime value. If your average contract generates 12 invoices at 2,500 euros each, lifetime value is 30,000 euros. If you can extend that to 18 invoices, lifetime value becomes 45,000 euros without acquiring a single new customer.
It also reveals retention health. A declining average means customers are leaving sooner. An increasing average means you are keeping them longer.
For service businesses, this metric shapes acquisition strategy. If customers only stay three months, you need to acquire constantly. If they stay 18 months, you can afford higher acquisition costs.
Calculate average invoices per contract:
Average invoices per contract = Total invoices / Total contracts (for a cohort or period)
Track this quarterly. Break it down by:
To increase this metric:
A consultancy averages 6 invoices per contract (6 months). They find that customers who churn early had poor onboarding experiences. They implement a structured 30-day onboarding programme. Average increases to 9 invoices per contract.
A marketing agency averages 8 invoices per contract. They introduce a new analytics service that existing clients can add. Clients who add the service stay an average of 14 months. Overall average increases to 10 invoices per contract.
A B2B software company averages 10 invoices per contract. They start running quarterly business reviews showing usage metrics and ROI. Customers who attend QBRs stay an average of 16 months. Overall average increases to 12 invoices.
How do you keep happy customers that keep buying from you?

Build an onboarding and retention system that keeps customers engaged, identifies risks early, and turns satisfaction into longer relationships.
Create upsell and cross-sell workflows that grow existing accounts by matching additional solutions to evolving customer needs.

Develop a pricing structure with clear value tiers, anchoring, and packaging that reflects the value you deliver and gives buyers confidence in their investment.

Set up ticket pipelines, customer success workspace, and health scores so your team catches problems before customers churn.
The average price charged per unit, seat, or item sold.
Design presentation slides that guide discovery and demo conversations whilst reinforcing key messages visually so prospects retain information after meetings end.
The average number of invoices issued per customer contract, reflecting contract length and billing frequency.
Determine how to charge for products and communicate value to maximise willingness to pay whilst remaining competitive and supporting desired positioning.
Create single-page summaries of solutions or case studies that busy decision-makers can quickly scan to understand value without reading long documents.
Survey customers about satisfaction with specific interactions or products to catch problems early and identify what drives positive experiences worth replicating.
Calculate what percentage of customers renew subscriptions to measure product-market fit and customer success effectiveness at delivering ongoing value.
The average number of units, seats, or items included on each invoice.
Provide formal pricing for requested solutions to move qualified prospects toward purchase decisions with clear costs and terms they can review and approve.
Collect specific customer quotes about results achieved to provide social proof that overcomes scepticism more effectively than marketing claims buyers discount.
Calculate the total revenue a customer relationship generates over its entire duration to guide acquisition spending and retention priorities.
Combine usage, engagement, and satisfaction signals into one metric that predicts churn risk so customer success teams prioritise accounts needing intervention.
Arm sales reps with competitive intelligence on one-page sheets covering competitor strengths, weaknesses, and effective counter-positioning for common objections.
Track how customers interact with your product to identify power users, detect at-risk accounts, and guide feature development toward actually valuable capabilities.
Measure customer loyalty by asking how likely they'd recommend you to gauge satisfaction and identify promoters who drive referrals versus detractors risking churn.
Follow structured selling frameworks that provide consistent processes for qualifying, demonstrating value, and advancing opportunities through each pipeline stage.
Proactively help customers achieve desired outcomes to drive retention and expansion by ensuring they extract maximum value from your solution.